News
Taking a closer look on Wheat – Part 2
Canopy monitoring using vegetation indices, radiative transfer modelling and artificial neural networks
Author: Lukas Koppensteiner
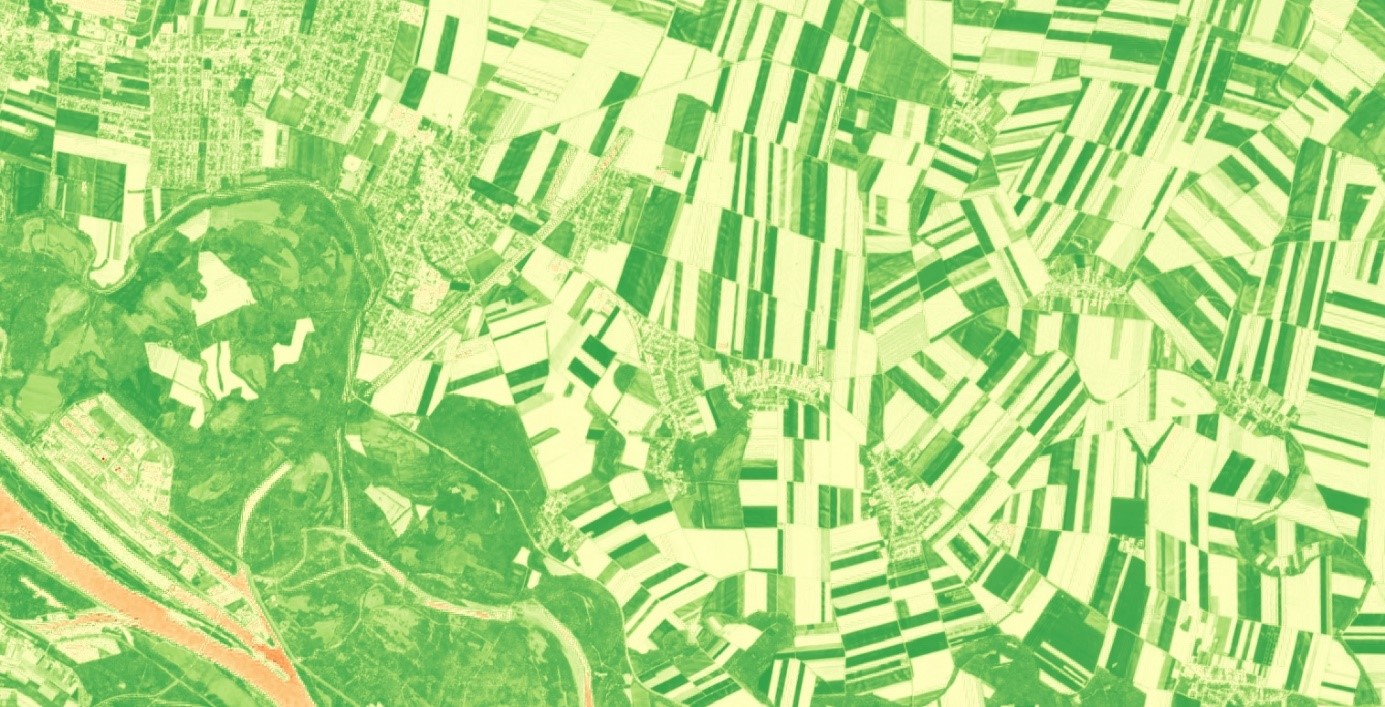
Plant canopies are continuously monitored throughout the season. Based on these observations, management procedures can be adapted accordingly, e.g. fertilization or plant protection. Continous monitoring is important, but also time-consuming. Plant canopies are often checked on a random sample basis due to time constraints. Here, the application of remote sensing data provides potential support. Especially the freely available Sentinel-2 satellite data is of value. Probably the simplest method to use remote sensing data is the calculation of vegetation indices, e.g. Normalized Difference Vegetation Index (NDVI) (Figure 1).

Figure 1: NDVI-map of Groß-Enzersdorf based on Sentinel-2 satellite data (April 22nd, 2020) (modified after ESA 2020). NDVI values close to 1 indicate a dense and healthy plant canopy. If the NDVI value is close to 0, then the canopy is unhealthy and sparse
NDVI provides basic information on canopy health. Relative differences within a plant canopy can be detected nicely, which would not be visible via manual control on the ground. Vegetation indices, however, do not generalize well. For example, if you want to estimate a canopy parameter, e.g. leaf area or chlorophyll content, based on NDVI values, then the model needs to be calibrated yearly for any given crop and cultivar.
An alternative is the use of radiative transfer models (RTMs). They describe the interaction between solar radiation and plant canopies (Monteith 1965). RTMs generalise well and have low calibration and validation requirements. Furthermore, RTMs can utilize all available spectral data (Berger et al. 2018). Sentinel-2 satellite data, for example, provides ten spectral bands, which are relevant for plant canopy analysis. In comparison, the calculation of most vegetation indices is based on two or three spectral bands.
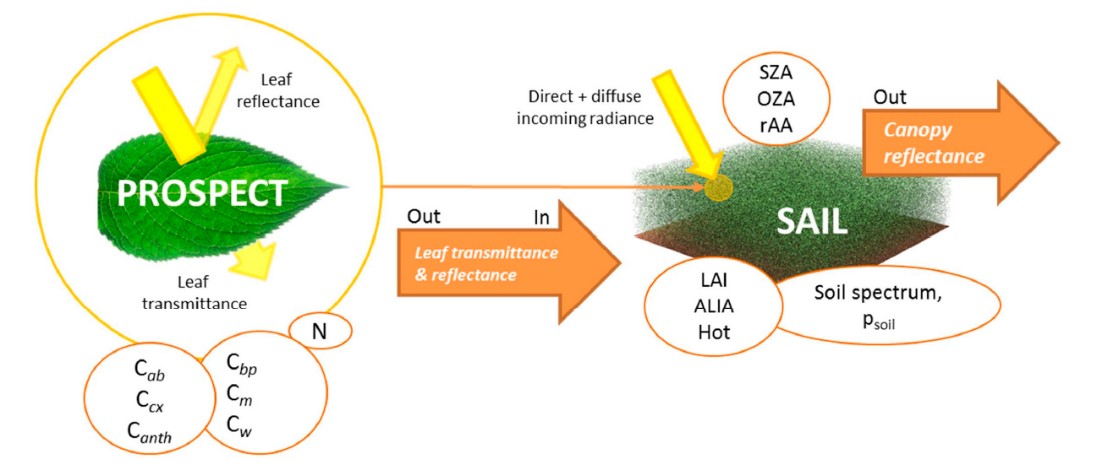
In the DiLaAg project, we work on the estimation of canopy parameters, e.g. leaf area index (LAI) and chlorophyll content, in Wheat (Triticum aestivum) using the RTM PROSAIL and artificial Neural Networks (ANNs). The RTM PROSAIL requires input data on canopy parameters and provides the simulated canopy reflectance as an output (Figure 2).

Figure 2: Calculation of the canopy reflectance using the PROSPECT + SAIL model (PROSAIL) (Berger et al. 2018). N (leaf structure index, Cab (chlorophyll content a + b), Ccx (carotenoid content), Canth (anthocyanin content), Cbp (brown pigments), Cm (dry matter content), Cw (water content), LAI (leaf area index), ALIA (apparent leaf inclination angle), Hot (hot spot parameter), ρsoil (soil reflectance), SZA (sun zenith angle), OZA (observer zenith angle), and rAA (relative azimuth angle).
We want to invert the RTM PROSAIL using an ANN. The resulting model requires the measured canopy reflectance as an input, e.g. sentinel-2 satellite data of plant canopies, and provides estimated canopy parameters, e.g. LAI and chlorophyll content, as an output. Currently, we are working on the optimization of model calibration. For model validation, data of a two-year DiLaAg field experiment at the experimental farm Groß-Enzersdorf of BOKU is used. For further information on the field experiment see the blog entry “Estimation of canopy parameters using remote sensing in wheat“.
The goal is to develop a model, that supports the continous monitoring of plant canopies. Furthermore, this model can be applied in the context of precision farming applications, e.g. site-specific nitrogen fertilization.
Berger K, Atzberger C, Danner M, D’Urso G, Mauser W, Vuolo F, Hank T, 2018: Evaluation of the PROSAIL Model Capabilities for Future Hyperspectral Model Environments: A Review Study. Remote Sens. 10, 85-110.
Monteith JL, 1965: Light Distribution and Photosynthesis in Field Crops. Ann. Bot. 29, 17-37.
