News
Estimation of canopy parameters using remote sensing in wheat
Estimation of canopy parameters using remote sensing in wheat
Author: Lukas Koppensteiner
Here the crucial question is: How can fertilization, plant protection, and irrigation be managed optimally?
Winter- and spring wheat plots were set up with differing nitrogen fertilization levels. In these plots, data on various crop canopy parameters were continuously collected traditionally. Examples for these parameters are developmental stages, soil coverage, plant height, above-ground dry mass, nitrogen content, chlorophyll content, and water content.
In the next step, classically collected data on canopy parameters and sensor measurements will be analyzed. These analyses will be conducted together with colleagues from the University of Technology Vienna. Examples of multispectral and hyperspectral data analysis procedures are vegetation indices, radiative transfer models, and neural networks.
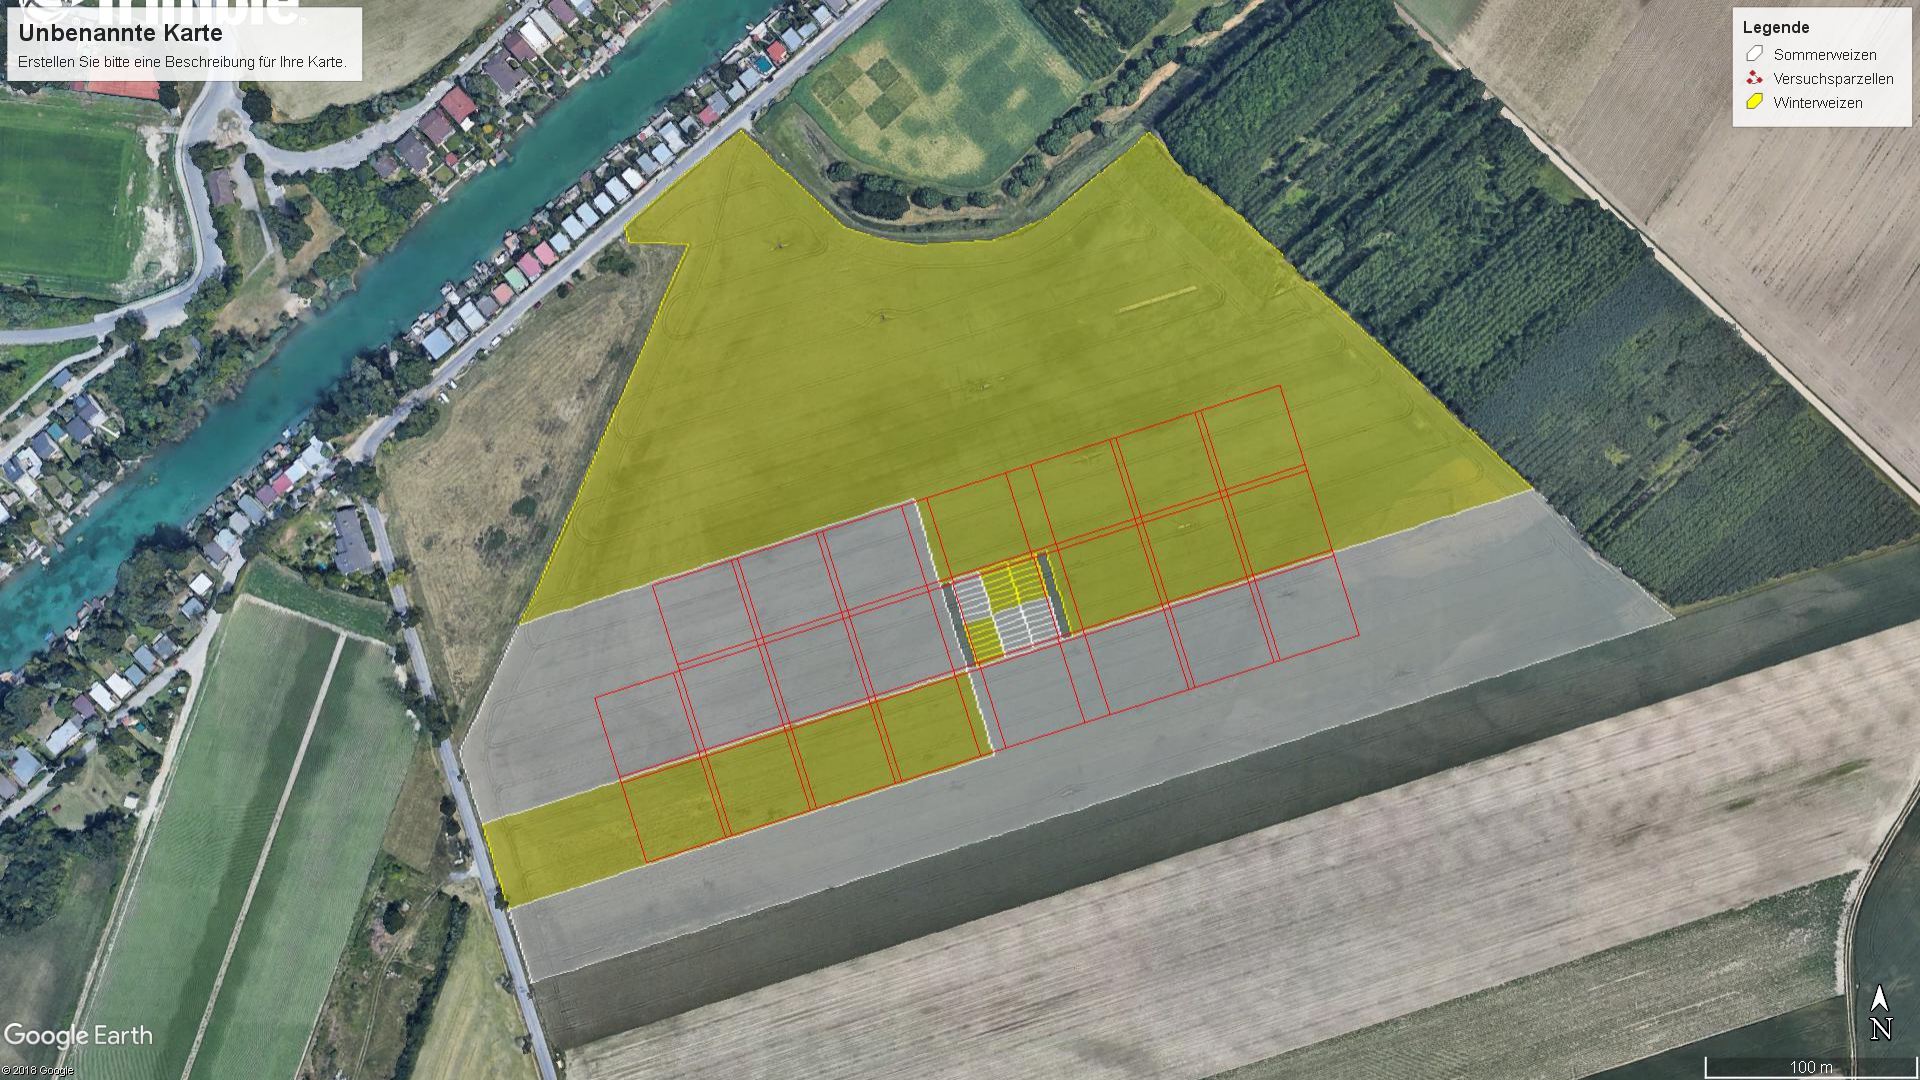
Figure 1: Field experiment at the experimental farm Groß-Enzersdorf (modified after Google Maps 2019). Winter wheat was sown in the yellow area. Spring wheat was sown in the white area. The small plot field experiment is located in the center, which is surrounded by large plots.
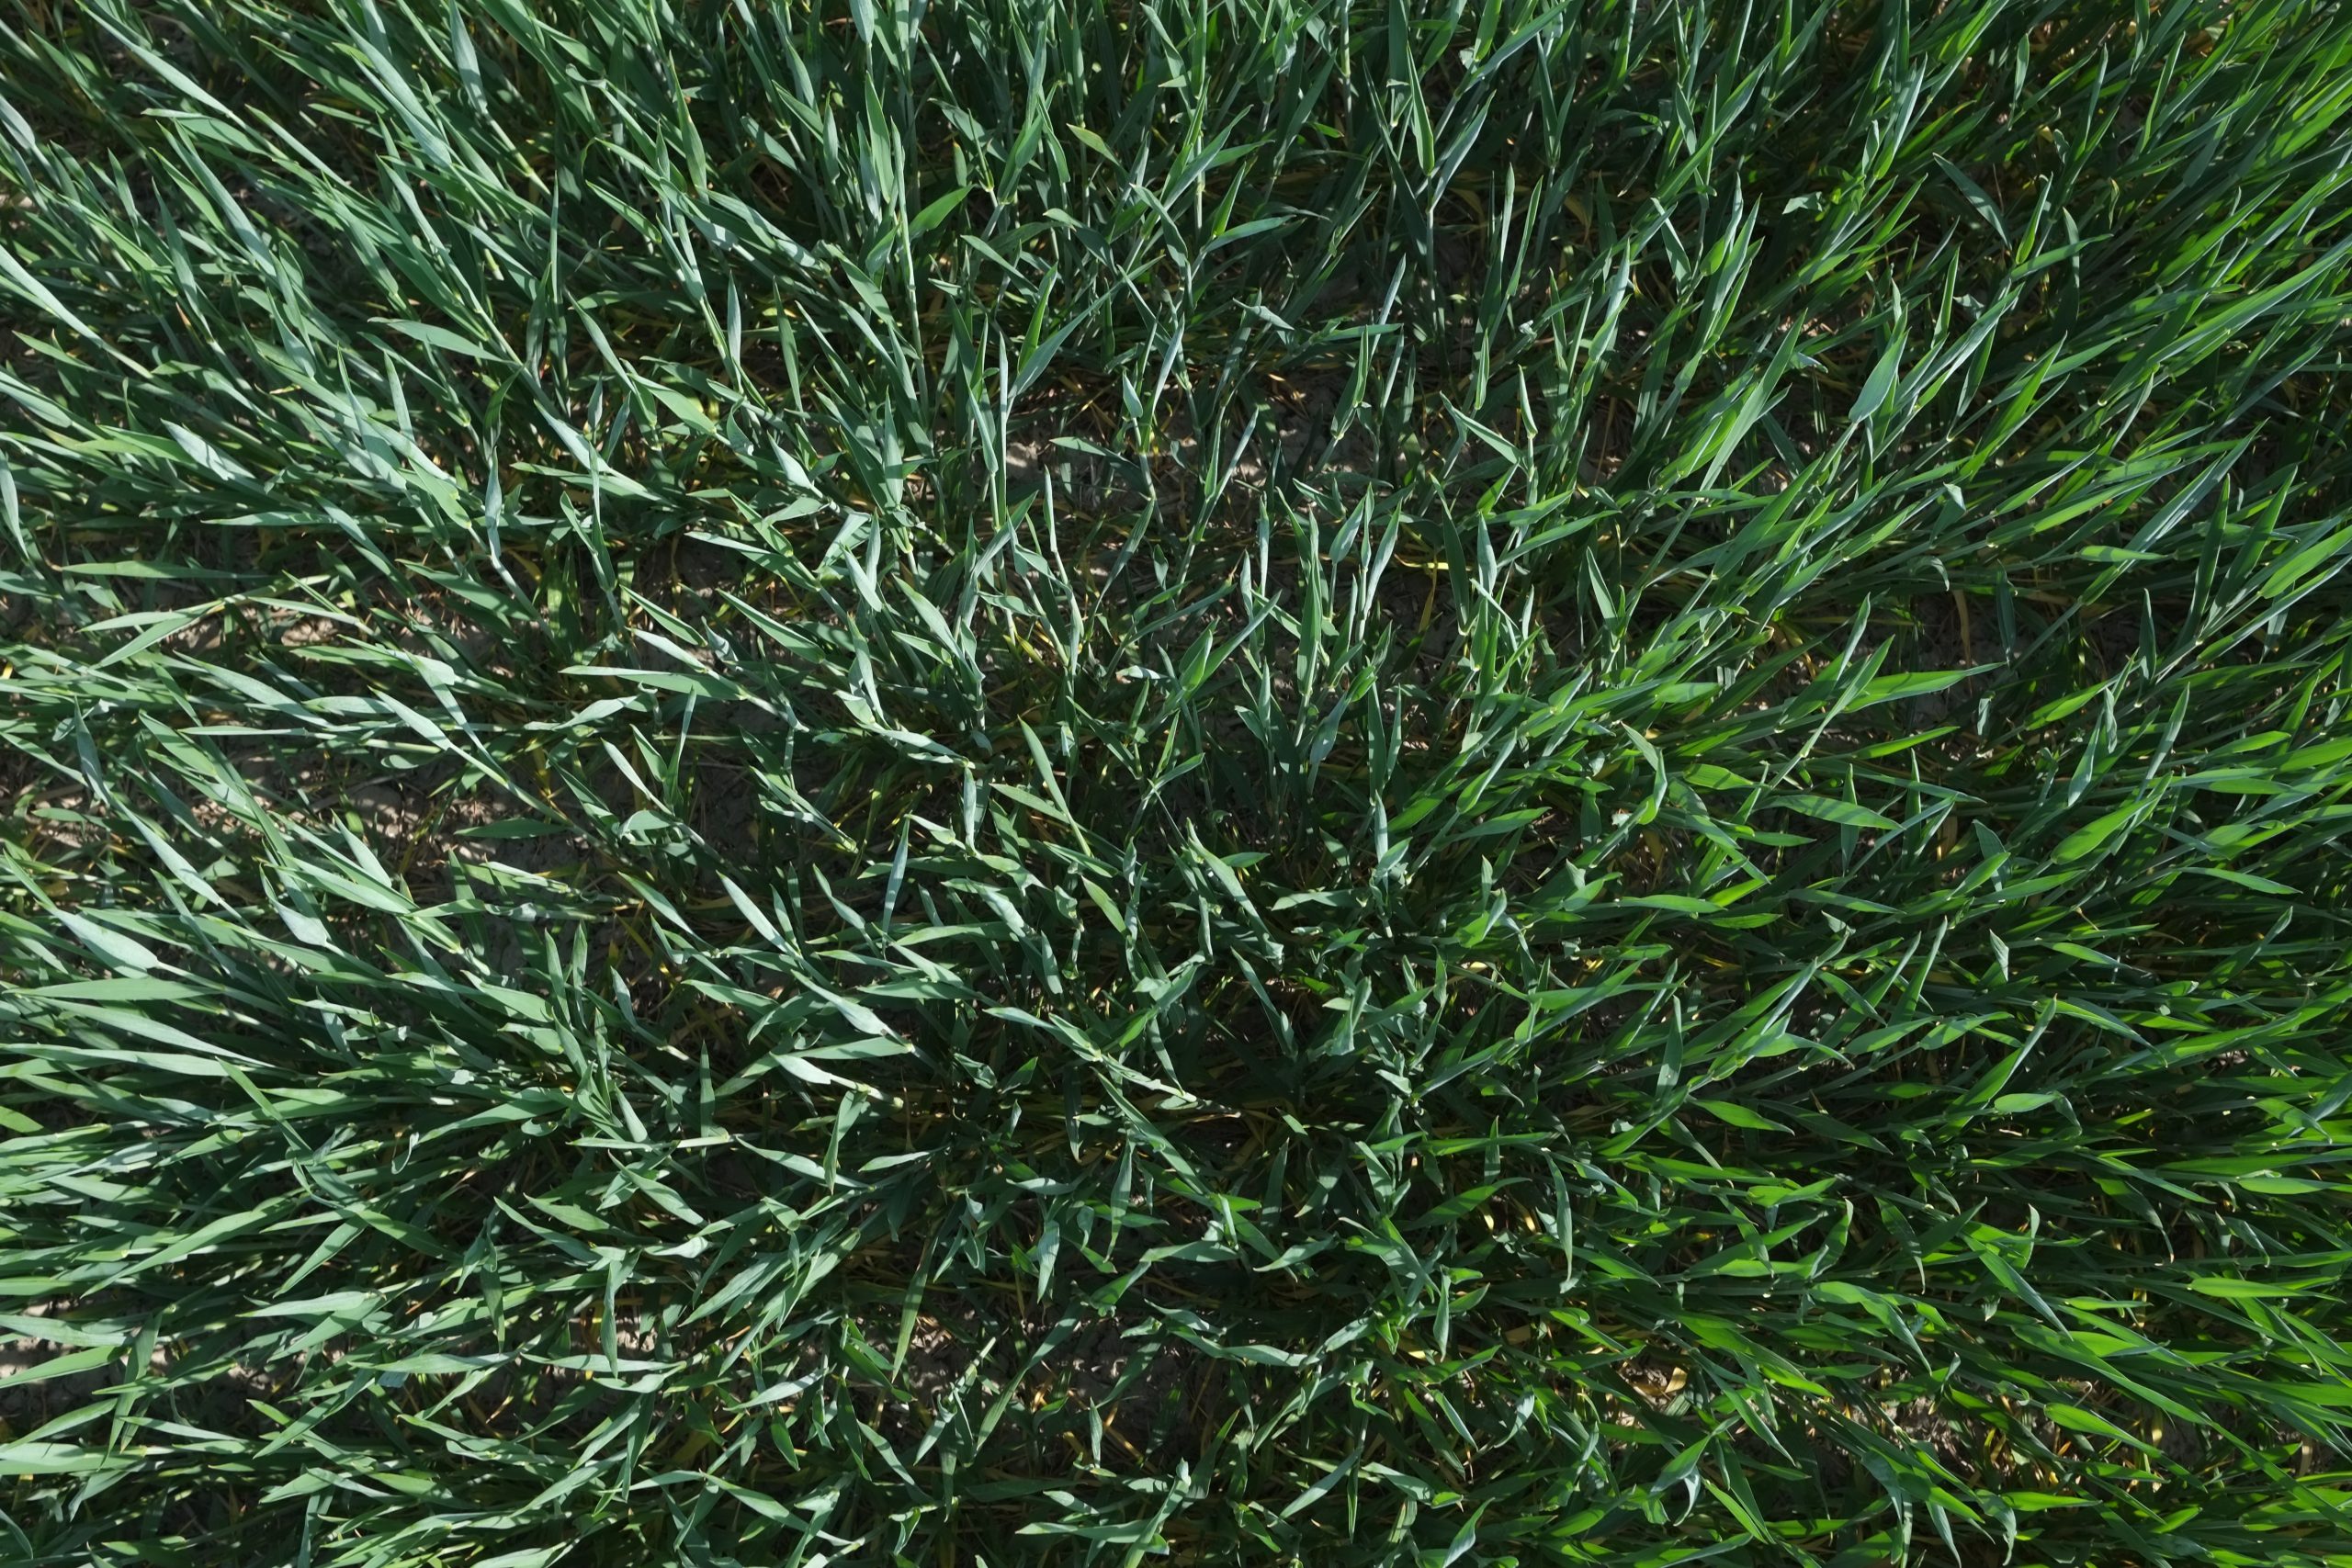
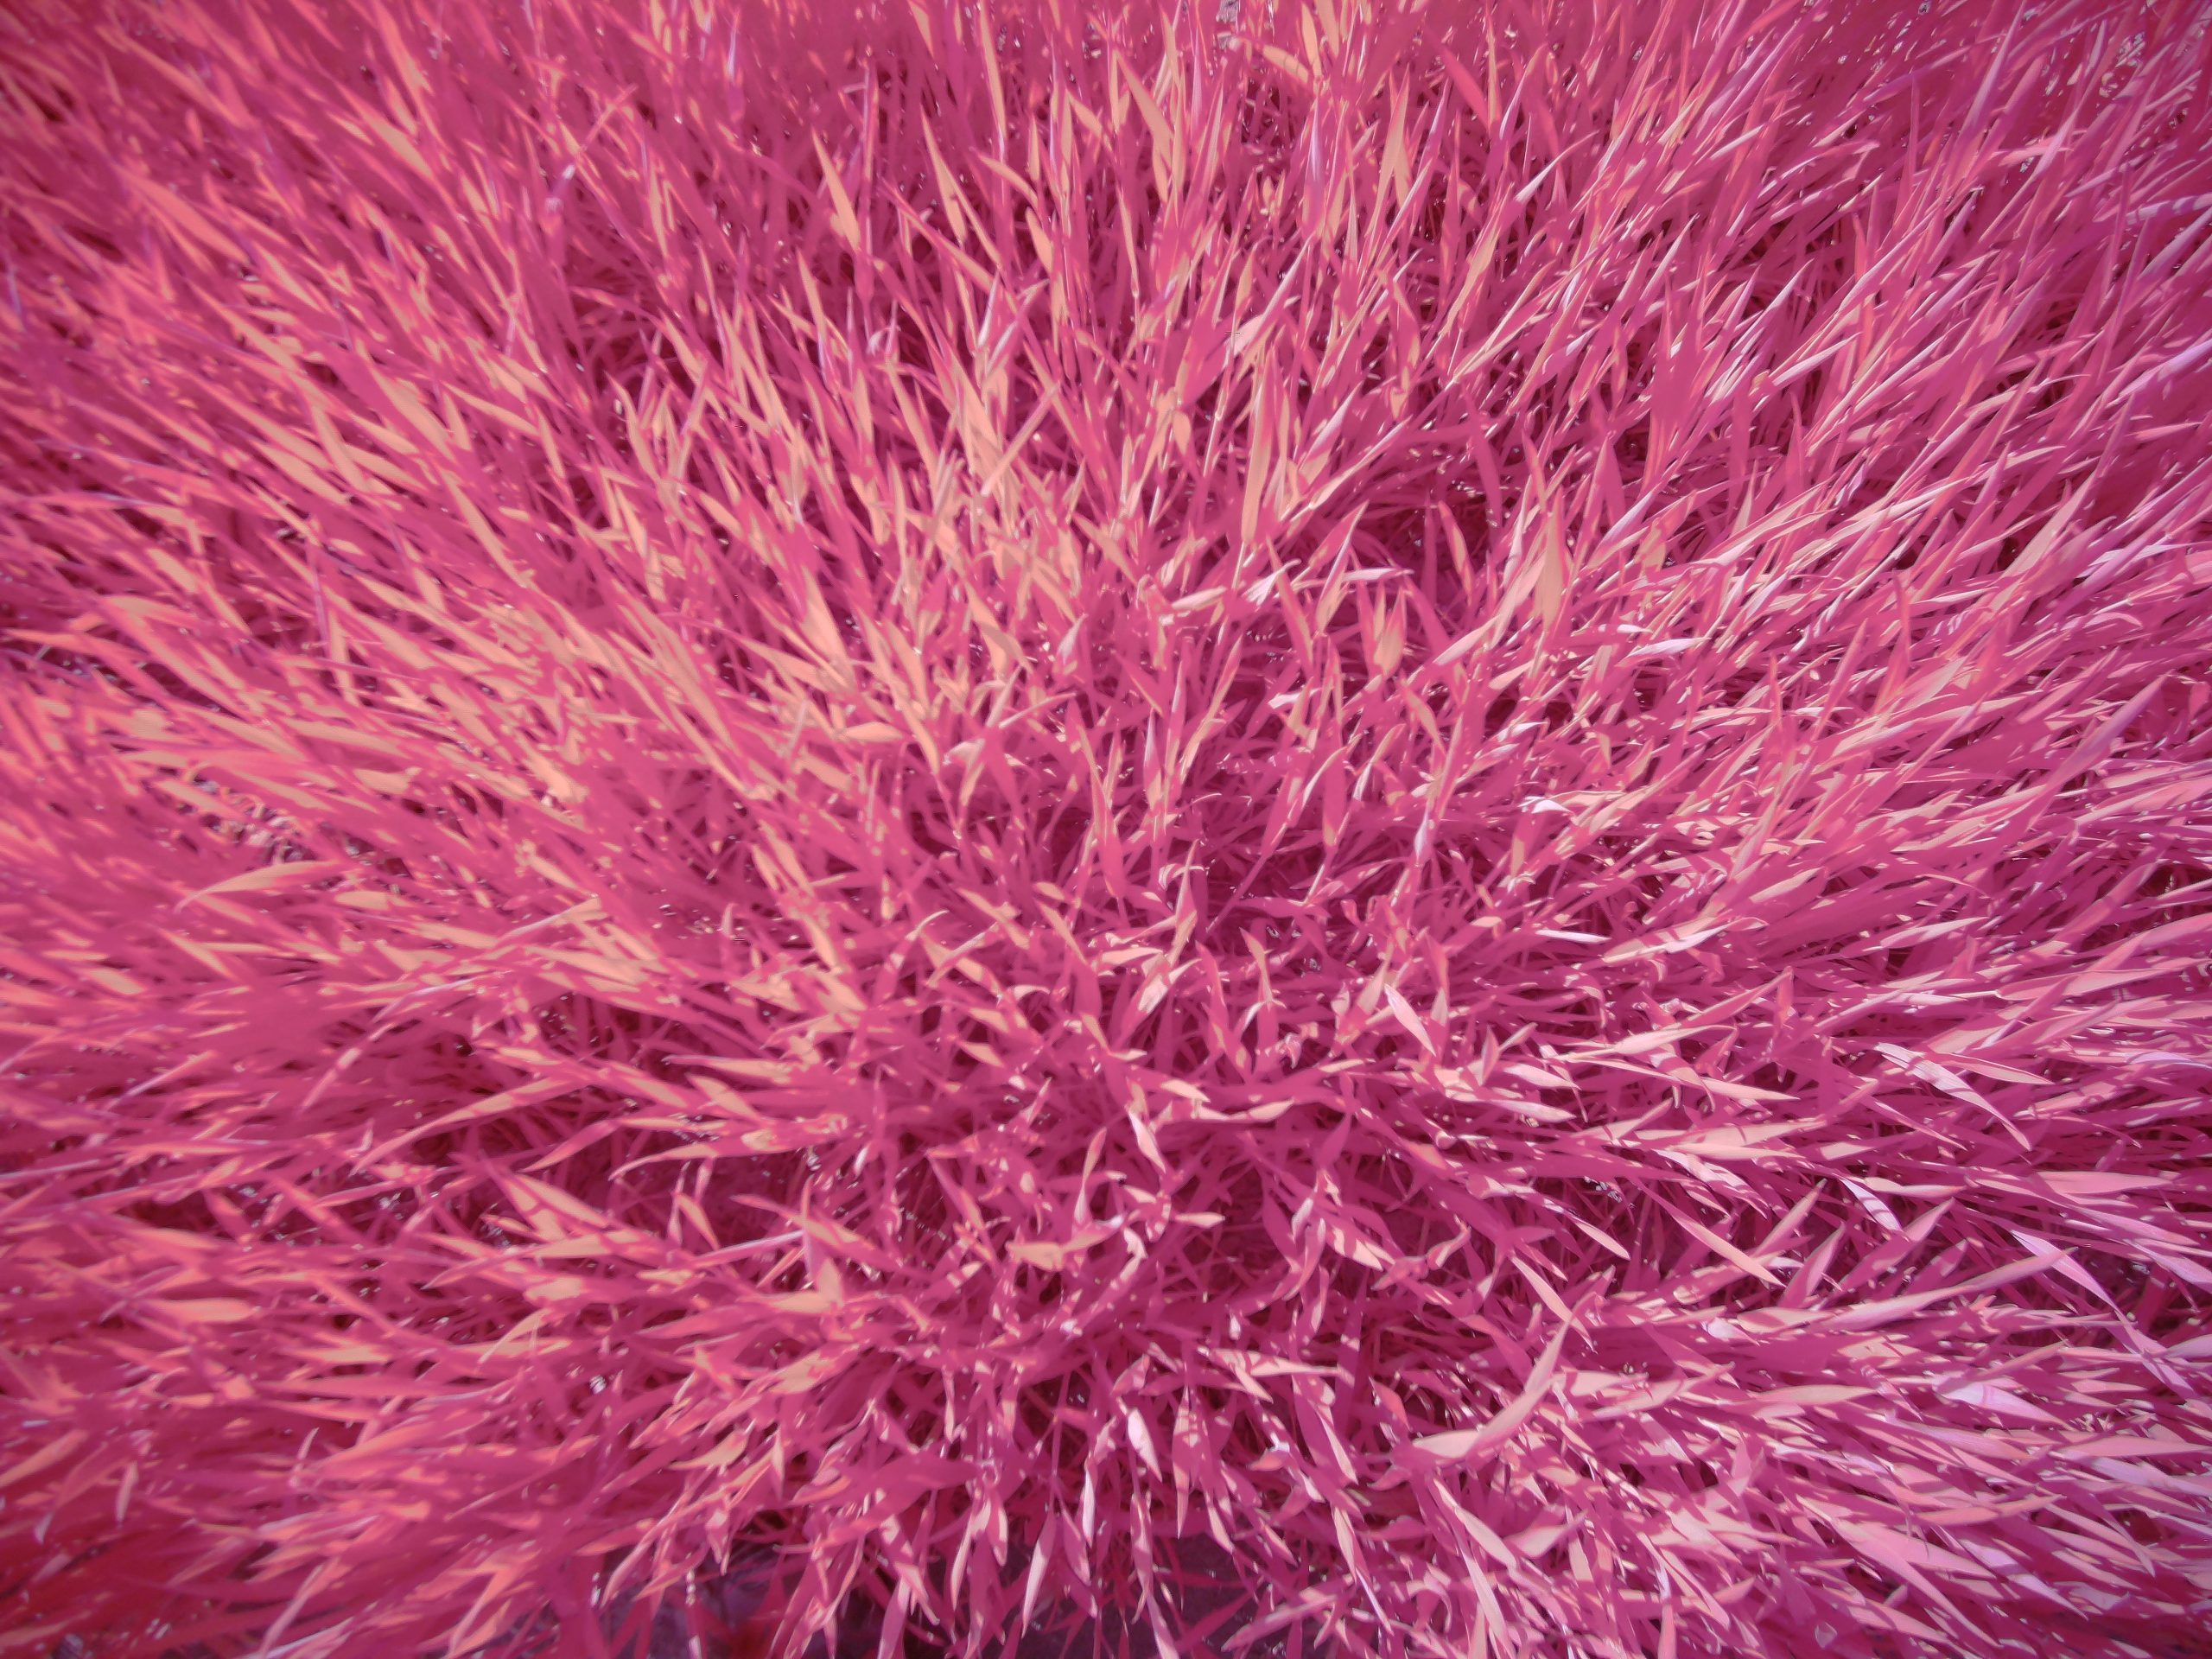
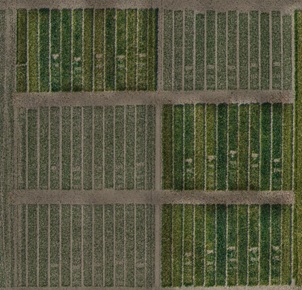
Figure 3: Aerial image of the small plot field experiment using an RGB camera (8.5.2020). The small plot field experiment consists of winter and spring wheat plots. The winter wheat plots are varying visibly according to their respective nitrogen fertilization level. The gaps in the plots indicate the positions at which destructive plant sampling was conducted.
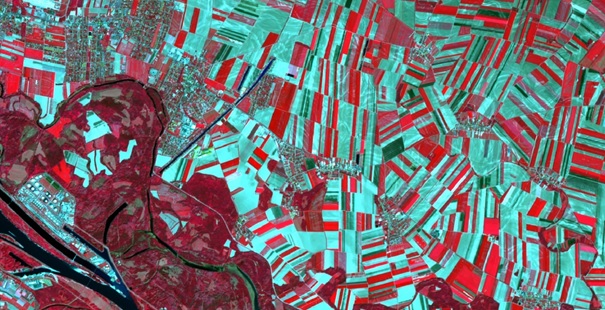
Figure 4: False-color composite of Groß-Enzersdorf based on a Sentinel-2 image (22.4.2020) (modified after ESA 2020). Near-infrared, red, and green are displayed as red, green, and blue. Bare soil and spring crops, which were sown recently, are shown in blue and green. Red indicates well-established vegetation, e.g., healthy winter crops.
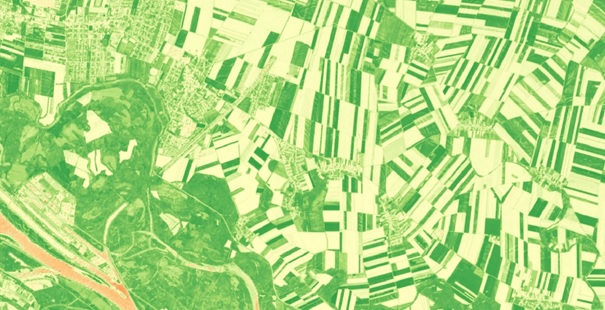
Figure 5: NDVI map of Groß-Enzersdorf based on a Sentinel-2 image (compare Figure 4, 22.4.2020) (modified after ESA 2020). In the next step, vegetation indices will be analyzed regarding relationships with various canopy parameters.
